Graphs
Note: Interactive graphics and our estimates of house effects are updated as new polls are published.
Developments since the Last General Election
FF FG SF SD LAB AU II GP SPBP Oth.Ind
Estimated support (%)
0
2
4
6
8
10
12
14
16
18
20
22
24
26
28
Dec 2024
Jan 2025
Feb 2025
Mar 2025
Apr 2025
May 2025
Jun 2025
Jul 2025
Aug 2025
Sep 2025
Oct 2025
Nov 2025
Dec 2025
Jan 2026
Feb 2026
Mar 2026
Apr 2026
May 2026
Jun 2026
This graph displays the development of party support in the Polling Indicator over time since the last elections. The shaded areas indicate the 95% uncertainty margin.
Show parties:
All Polls
FF - IPI FF - Ipsos B&A FF - IT FF - Red C
Estimated support (%)
13
14
15
16
17
18
19
20
21
22
23
24
25
26
Dec 2024
Jan 2025
Feb 2025
Mar 2025
Apr 2025
May 2025
Jun 2025
Jul 2025
Aug 2025
Sep 2025
Oct 2025
Nov 2025
Dec 2025
Jan 2026
Feb 2026
Mar 2026
Apr 2026
May 2026
Jun 2026
The line displays the Polling Indicator estimate with the 95% uncertainty margin shaded. Dots indicate the polls. Mouseover to see exact values. The polls are plotted in the (middle of the) fieldwork period, not the publication date.
Select party:
Select pollster(s):
Gains/Losses
FF
Difference with last Polling Indicator (%)
-1
0
1
2
3
4
5
6
7
8
Dec 2024
Jan 2025
Feb 2025
Mar 2025
Apr 2025
May 2025
Jun 2025
Jul 2025
Aug 2025
Sep 2025
Oct 2025
Nov 2025
Dec 2025
Jan 2026
Feb 2026
Mar 2026
Apr 2026
May 2026
Jun 2026
This graph displays gains or losses per party. This concerns the difference with the most recent poll. A positive score indicates that a party was polling higher at that moment in time than now; a negative score indicates that it was polling worse at that particular time. The shaded area indicates the 95% uncertainty margin; if this margin does not include zero, there is a statistically significant difference between the party score now and in the past.
Show parties:
Differences
FF - FG
Difference in support between two parties (%)
-4
-3
-2
-1
0
1
2
3
4
5
6
Dec 2024
Jan 2025
Feb 2025
Mar 2025
Apr 2025
May 2025
Jun 2025
Jul 2025
Aug 2025
Sep 2025
Oct 2025
Nov 2025
Dec 2025
Jan 2026
Feb 2026
Mar 2026
Apr 2026
May 2026
Jun 2026
This graph displays the differences between pairs of parties. Select party 1 and 2 to display the difference in support for them. A positive number means that party 1 was bigger than party two, a negative number means that party 1 is smaller than party 2. The shaded area indicates the 95% uncertainty margin. If it does not cross the line at zero, the difference between two parties is statistically significant at that date. If the shaded area does cross the zero line then we cannot conclude which party is bigger based on the available data.
Party 1:
Party 2:
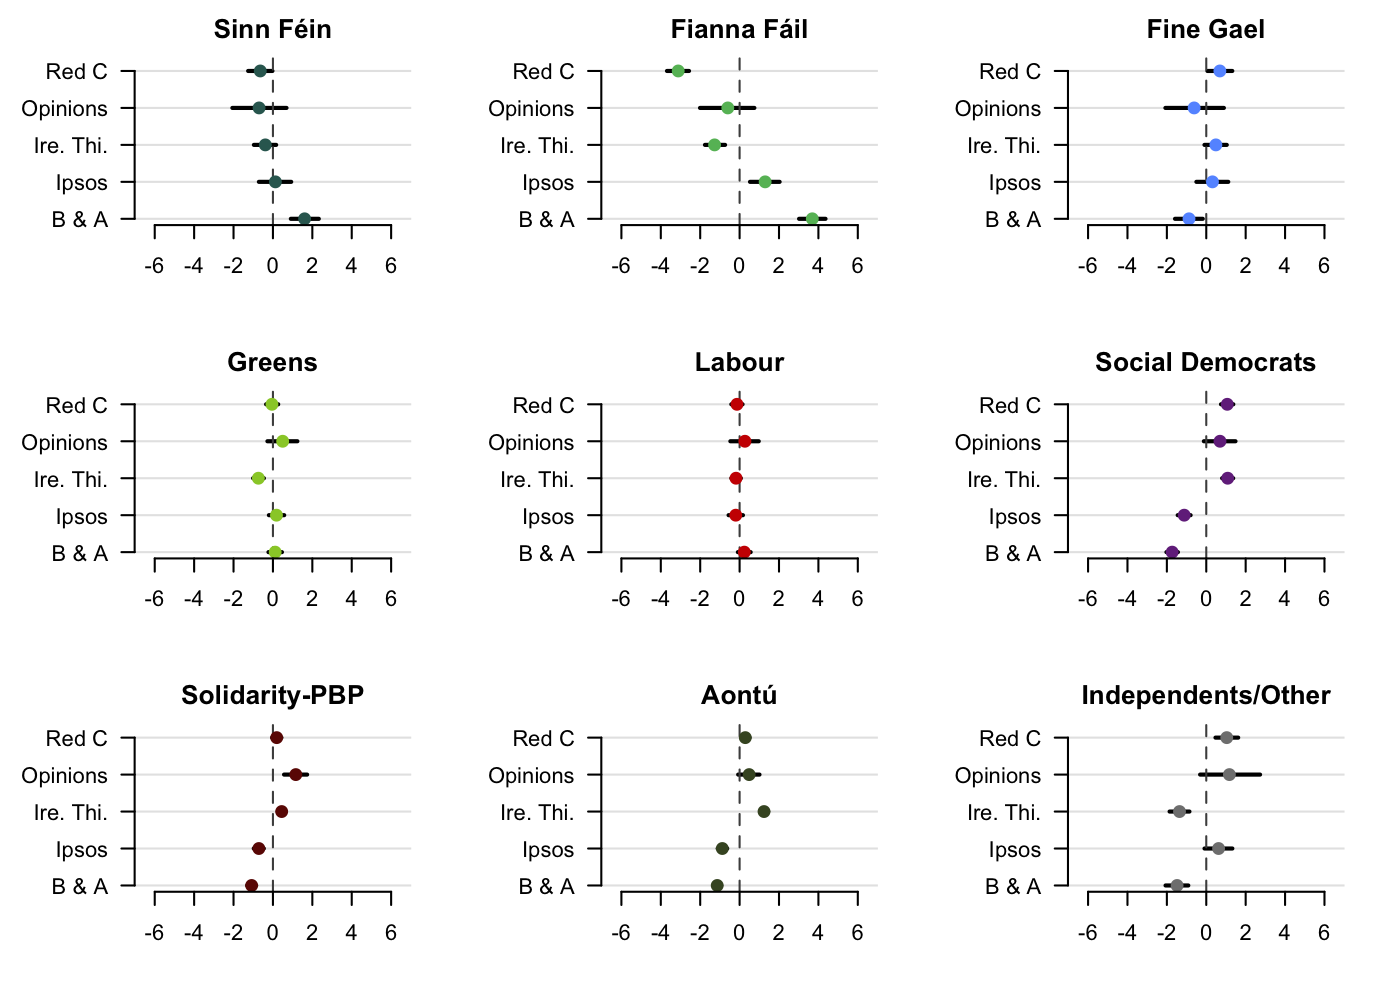
House Effects